Dashboard
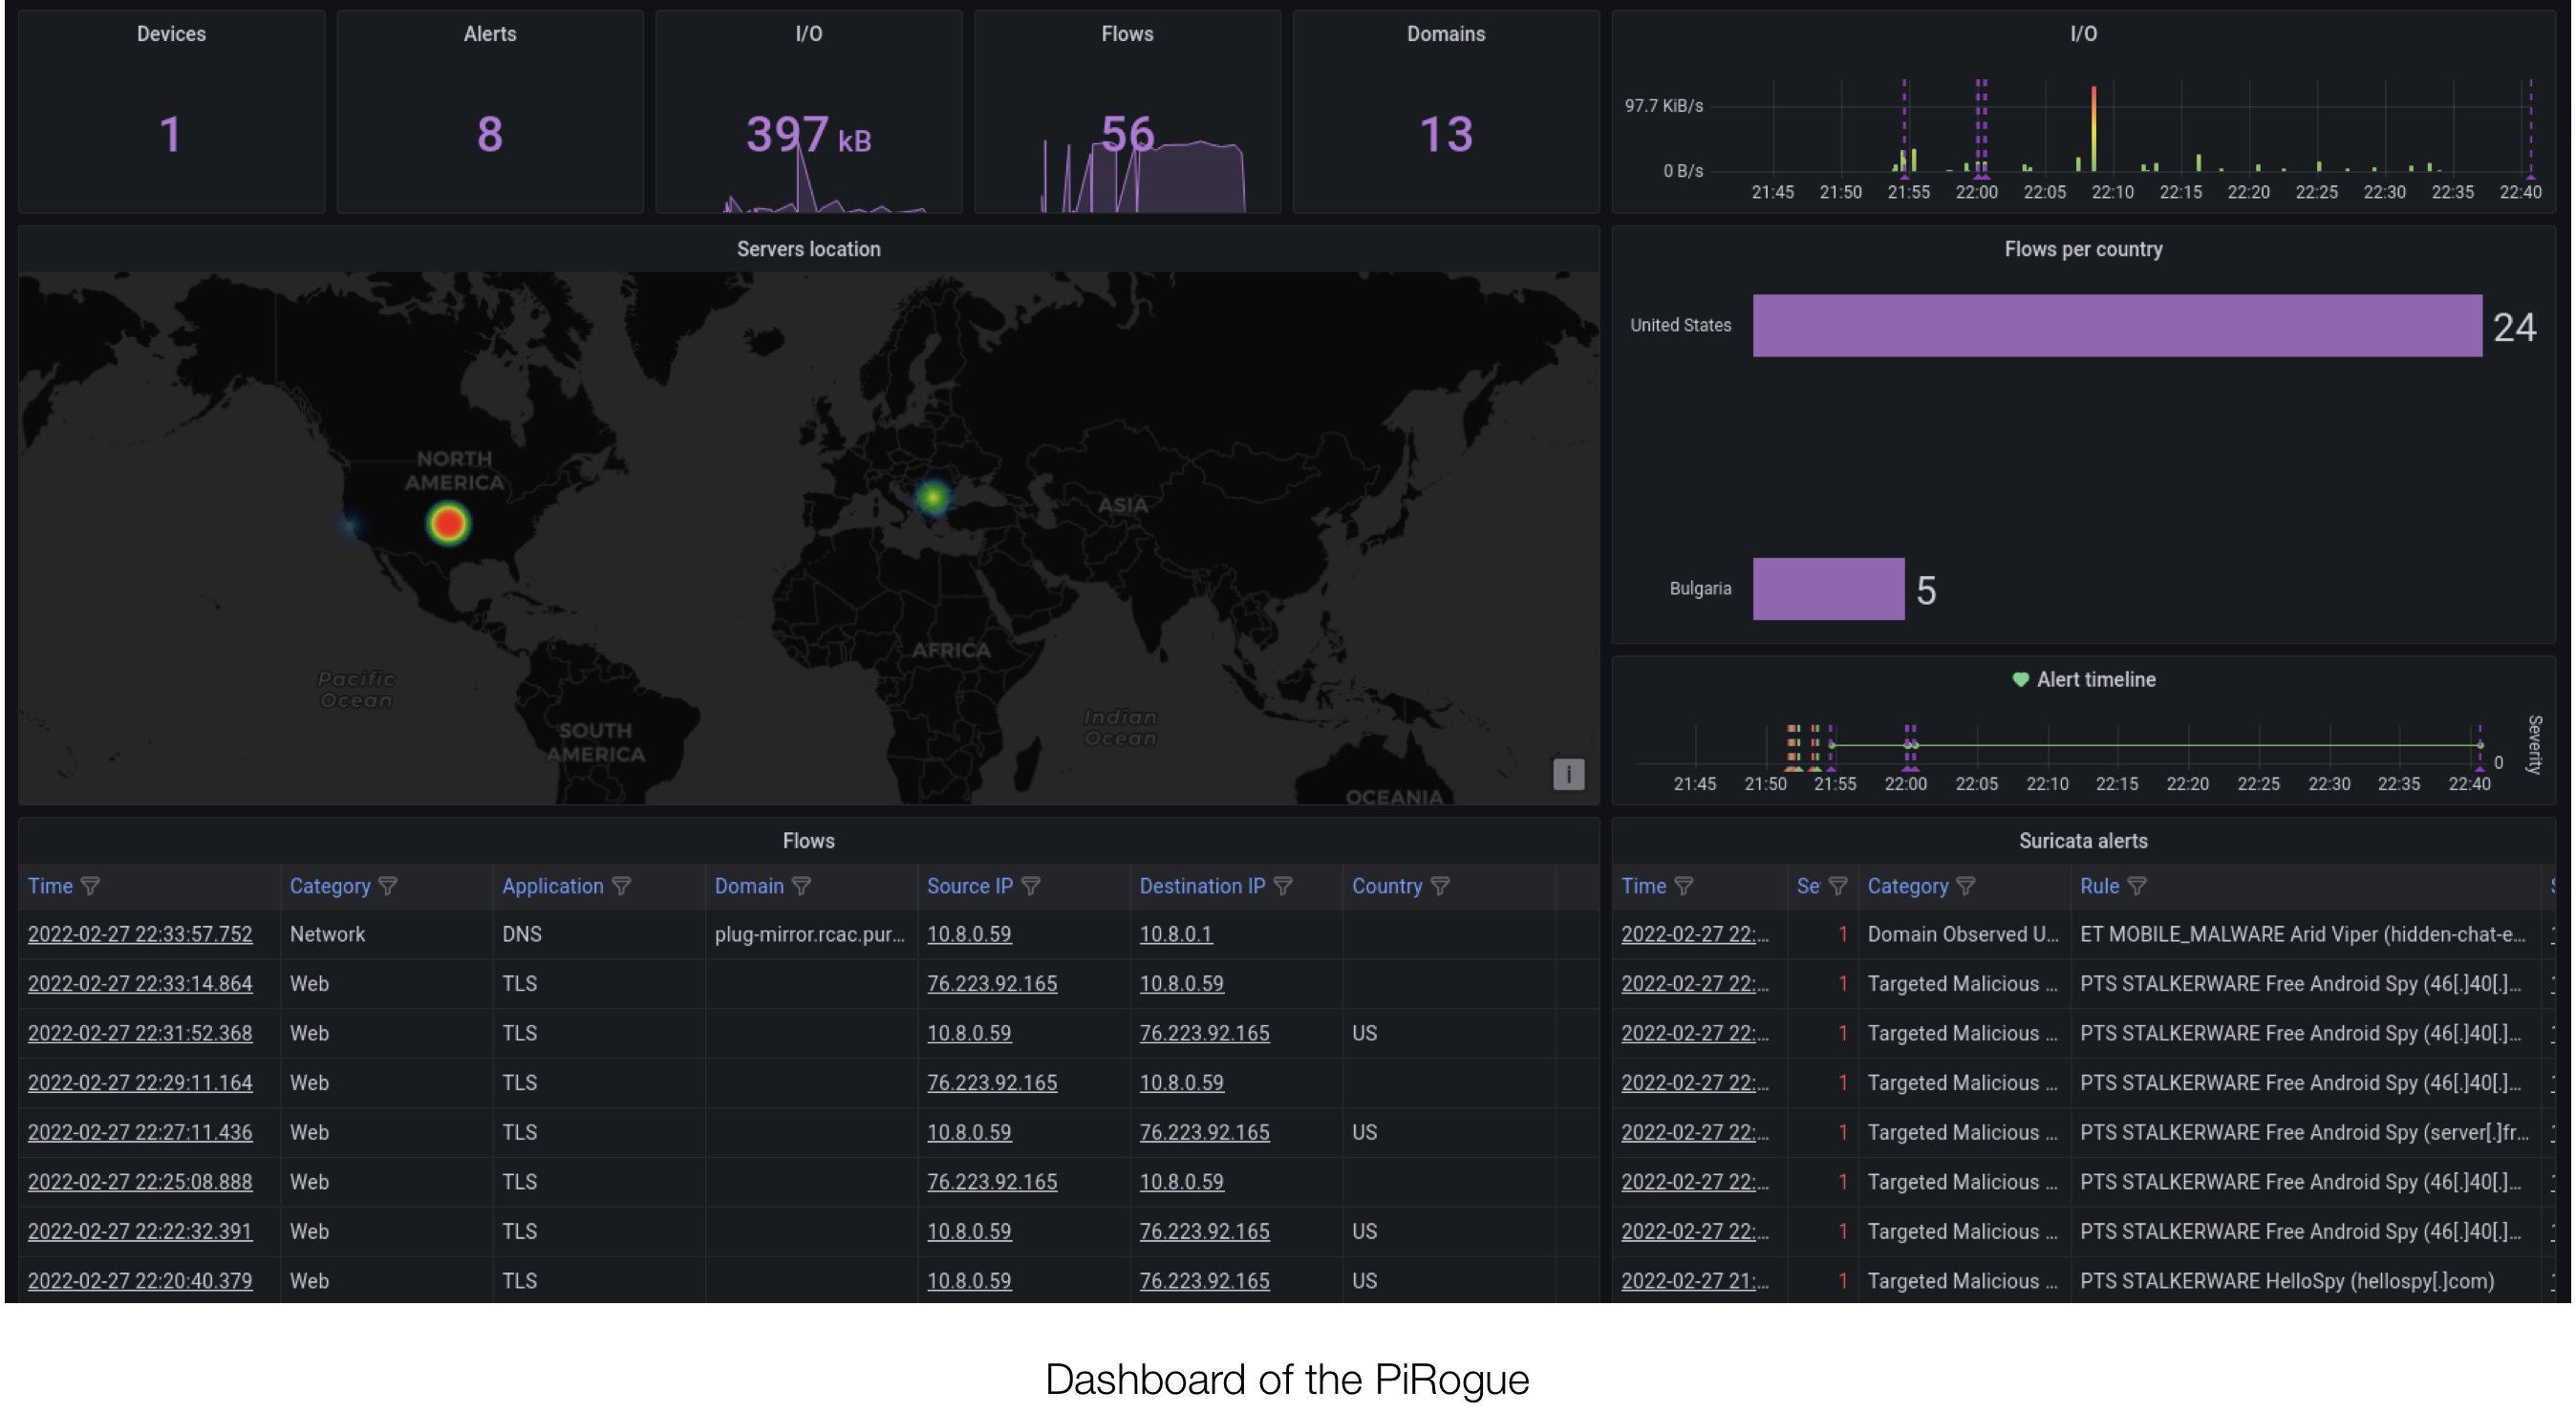
Your PiRogue runs a Grafana dashboard that shows, in near real time, the network connections of the connected devices and the security alerts raised by Suricata.
The PiRogue keeps 5 days of history. Older data is automatically deleted. To keep it, see Export data.
Use the time picker at the top right to choose the period displayed by every panel.
General statistics
Five figures summarize the selected period:
- Connected devices: the number of different devices that connected to the PiRogue
- Security alerts: the number of alerts raised by Suricata rules, which may indicate an intrusion attempt, malicious activity or a policy violation
- Network I/O: the amount of data exchanged between the devices and the Internet
- Network flows: the number of communication sessions between the devices and remote servers
- Contacted domains: the number of different domain names contacted
World map
The location of the servers the devices communicated with. A quick way to spot a country you did not expect.
Network flows
One row per network flow:
| Column | Meaning |
|---|---|
| Time | When the flow started |
| Category | The type of traffic, as classified by NFStream |
| Application | The application that generated the flow |
| Domain | The name of the contacted server |
| Source / Destination | The IP addresses of both ends of the flow |
| Country | Where the remote server is located |
| Volume | The amount of data exchanged |
Sort and filter this list to find patterns: which application talks the most, which domain appears only at night, and so on.
Security alerts
One row per alert raised by Suricata:
| Column | Meaning |
|---|---|
| Time | When the alert was raised. Click it to open the details of the alert |
| Severity | How urgent the detected threat is |
| Category | The type of threat |
| Signature | The name of the rule that matched |
| Source / Destination | The IP addresses involved. Depending on the rule, the source is the origin of the threat or the destination is the target |
To understand exactly why an alert fired, look up its signature: see Suricata rules.